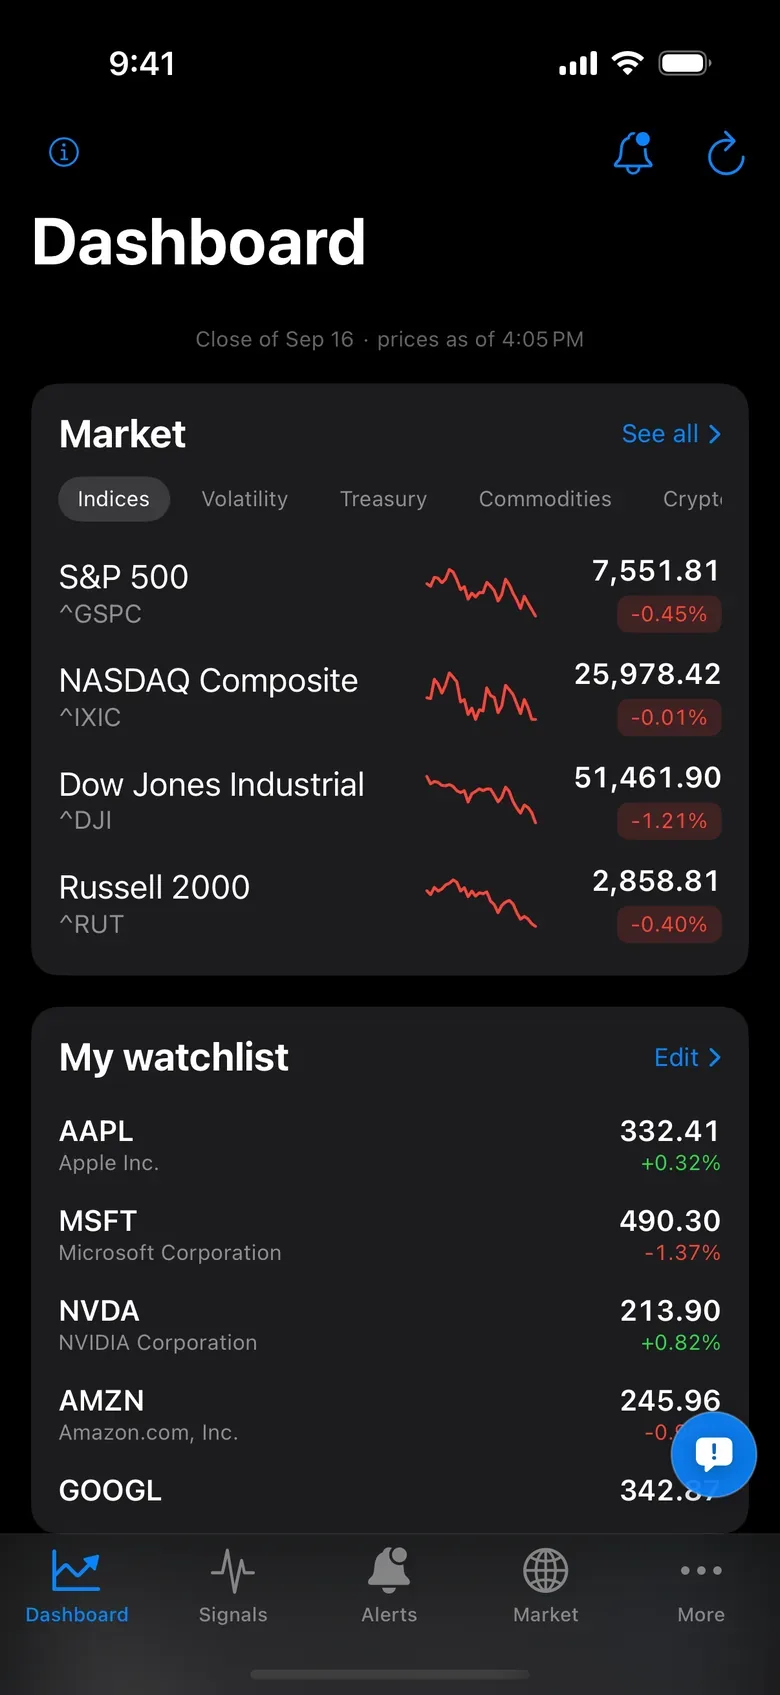
One screen
Your market and your stocks, together — what moved, what crossed, and what you are watching.
Captured from the app on a phone rather than drawn in a mockup, and re-captured whenever the app changes. The numbers in them are real market data from the session they were taken.
Your market and your stocks, together — what moved, what crossed, and what you are watching.
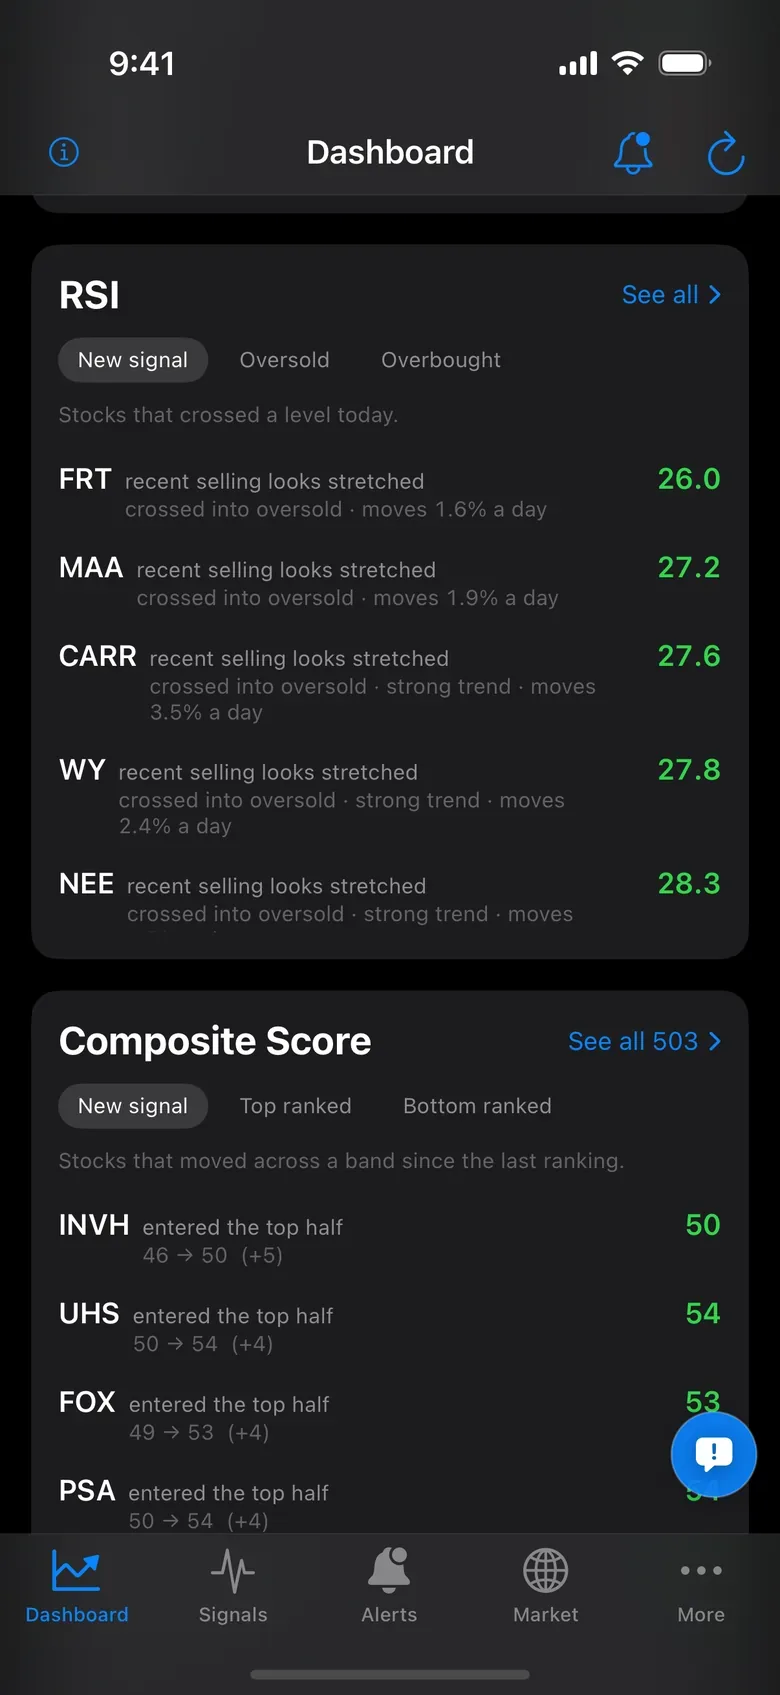
Not a list of what is oversold. A list of what just became oversold, which is the part you can act on.
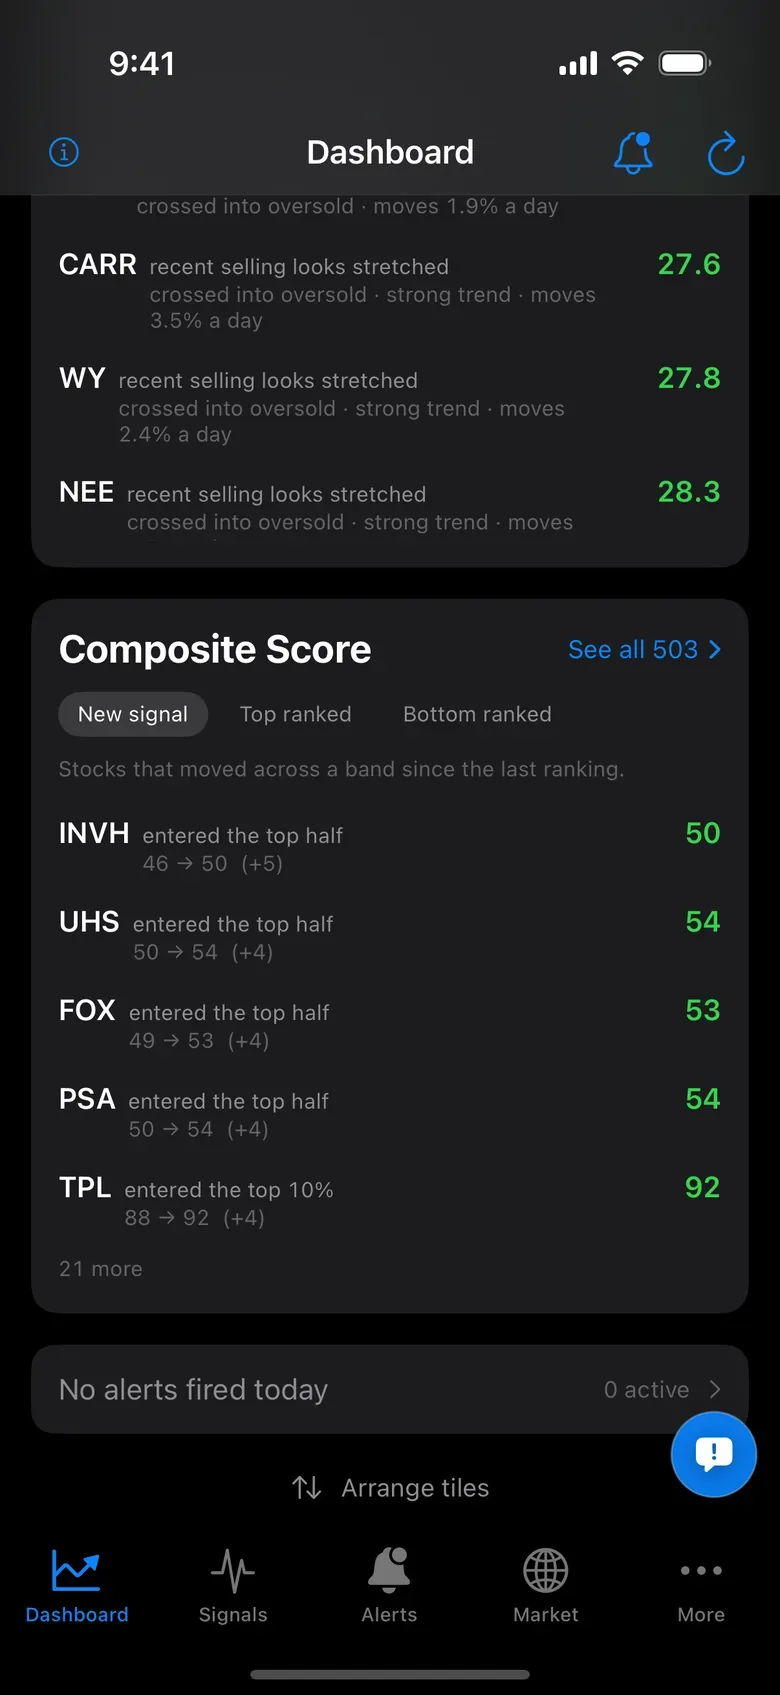
Every S&P 500 stock scored on earnings, strength, quality, accumulation and sector, then re-ranked against the other 502.
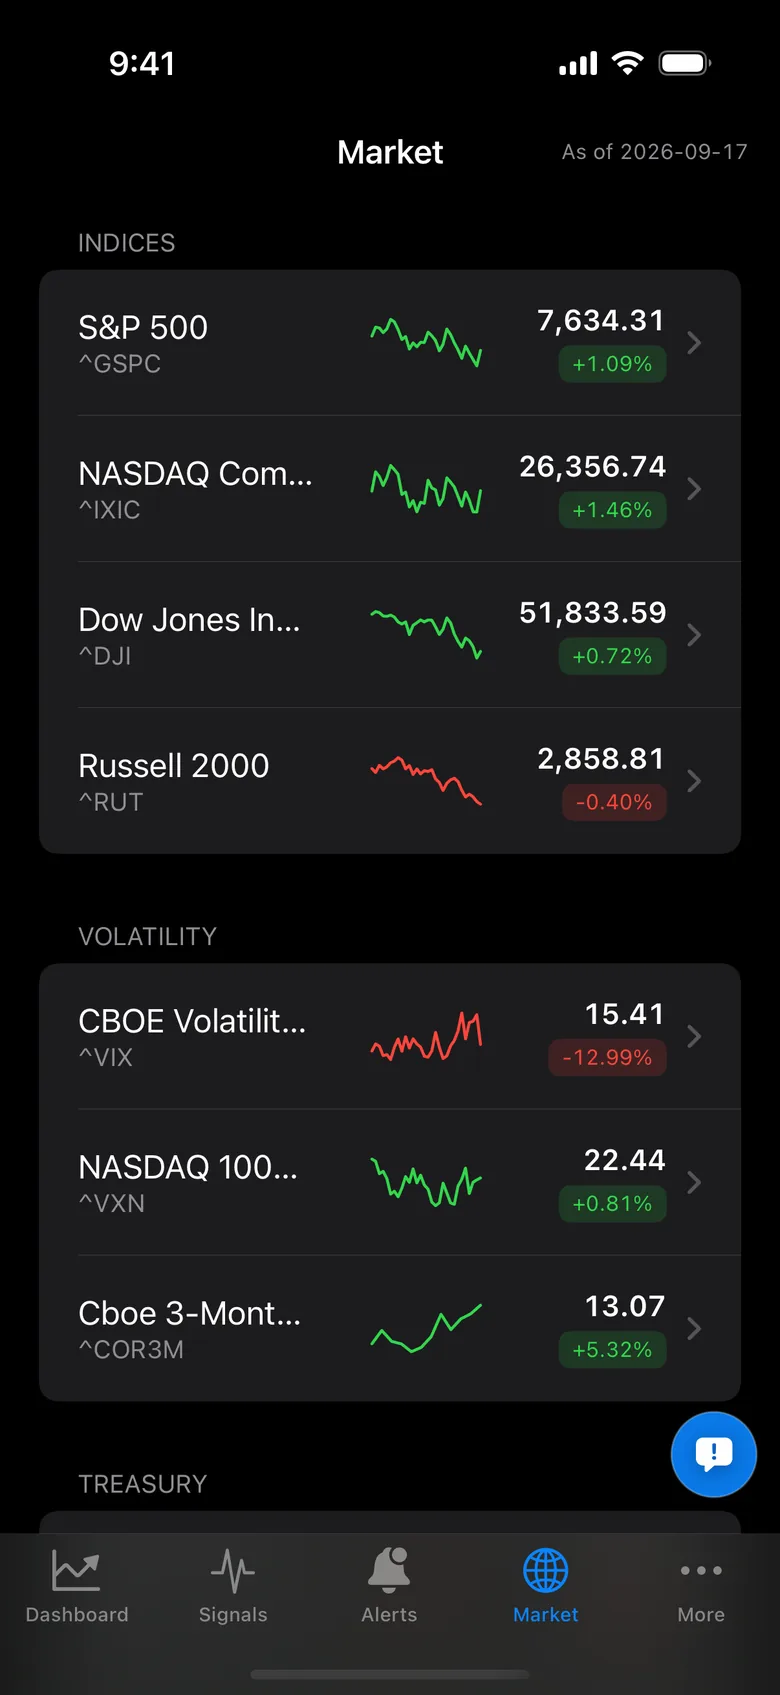
Indices, volatility, rates and crypto, each saying whether its figure has settled for the day or is still moving.
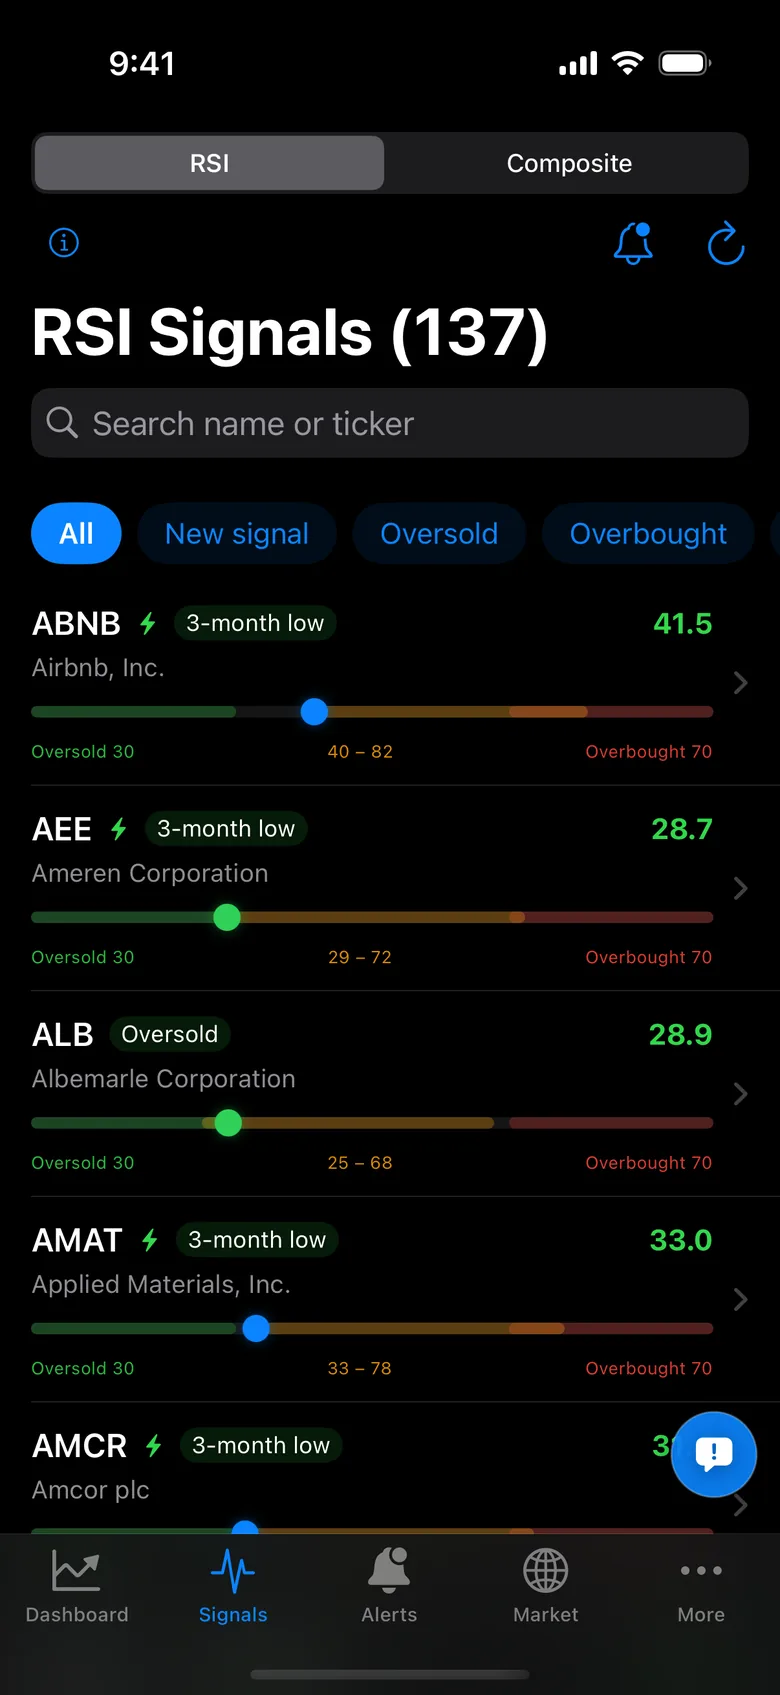
Today's signals with the filters you actually want — new crossings, oversold, overbought — rather than everything at once.
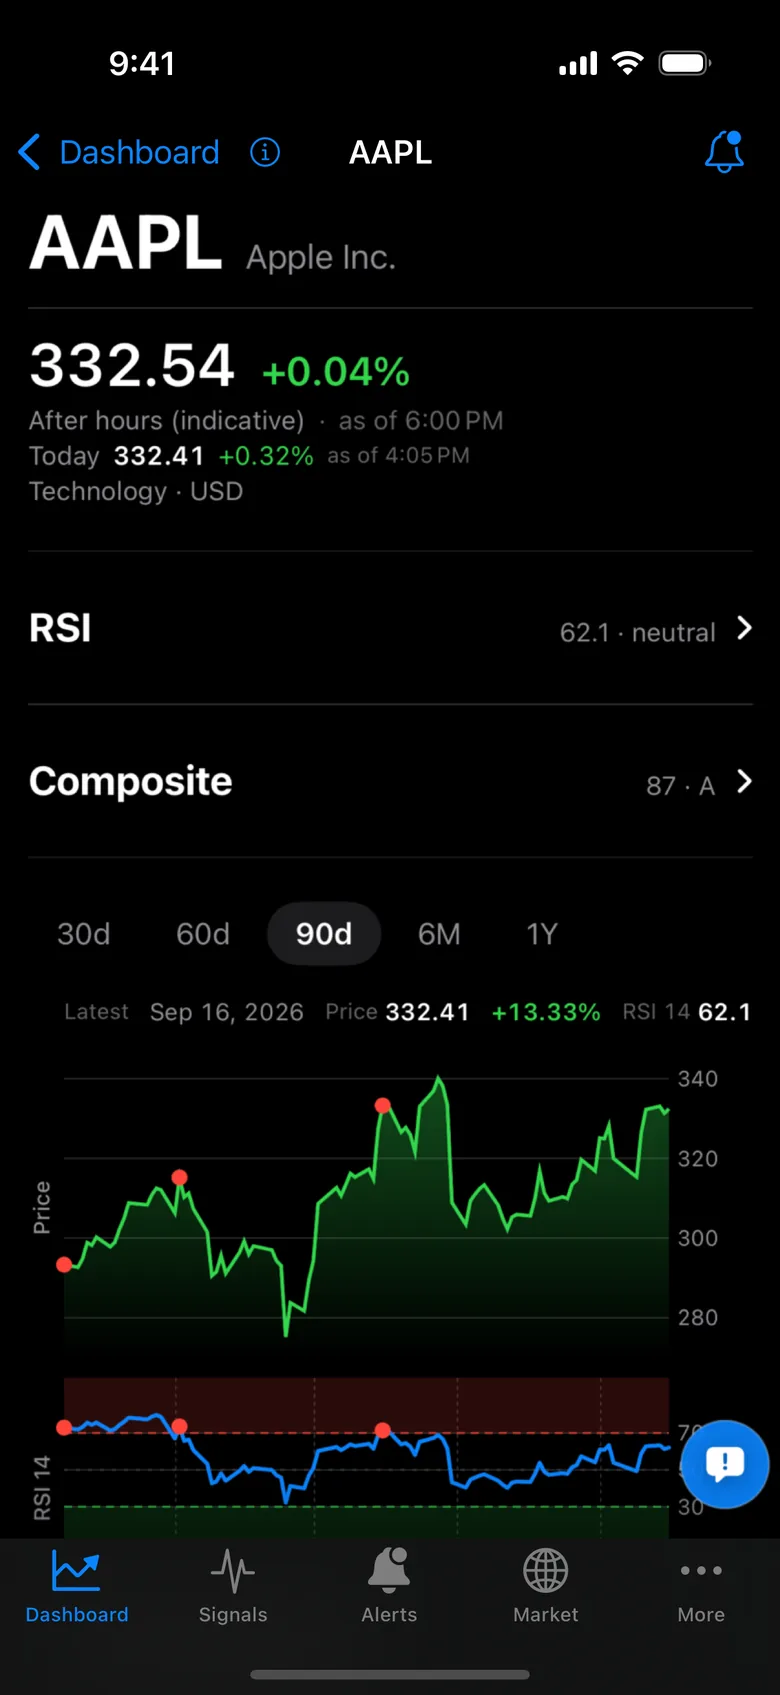
Price, RSI and Composite together, with extended-hours prices shown as context and never computed on.
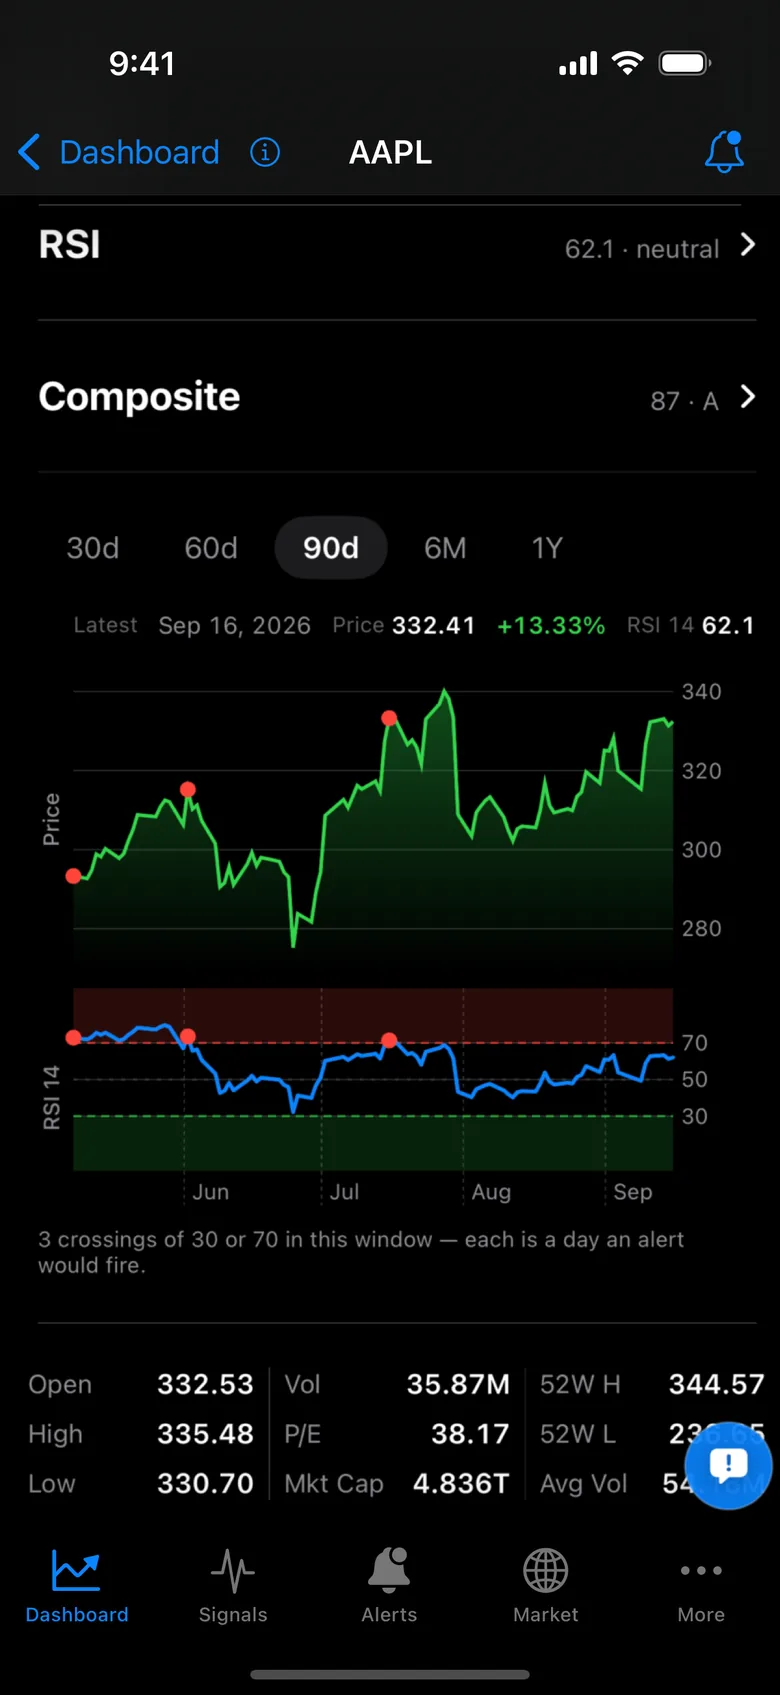
Price and RSI on the same timeline, with the fundamentals underneath.
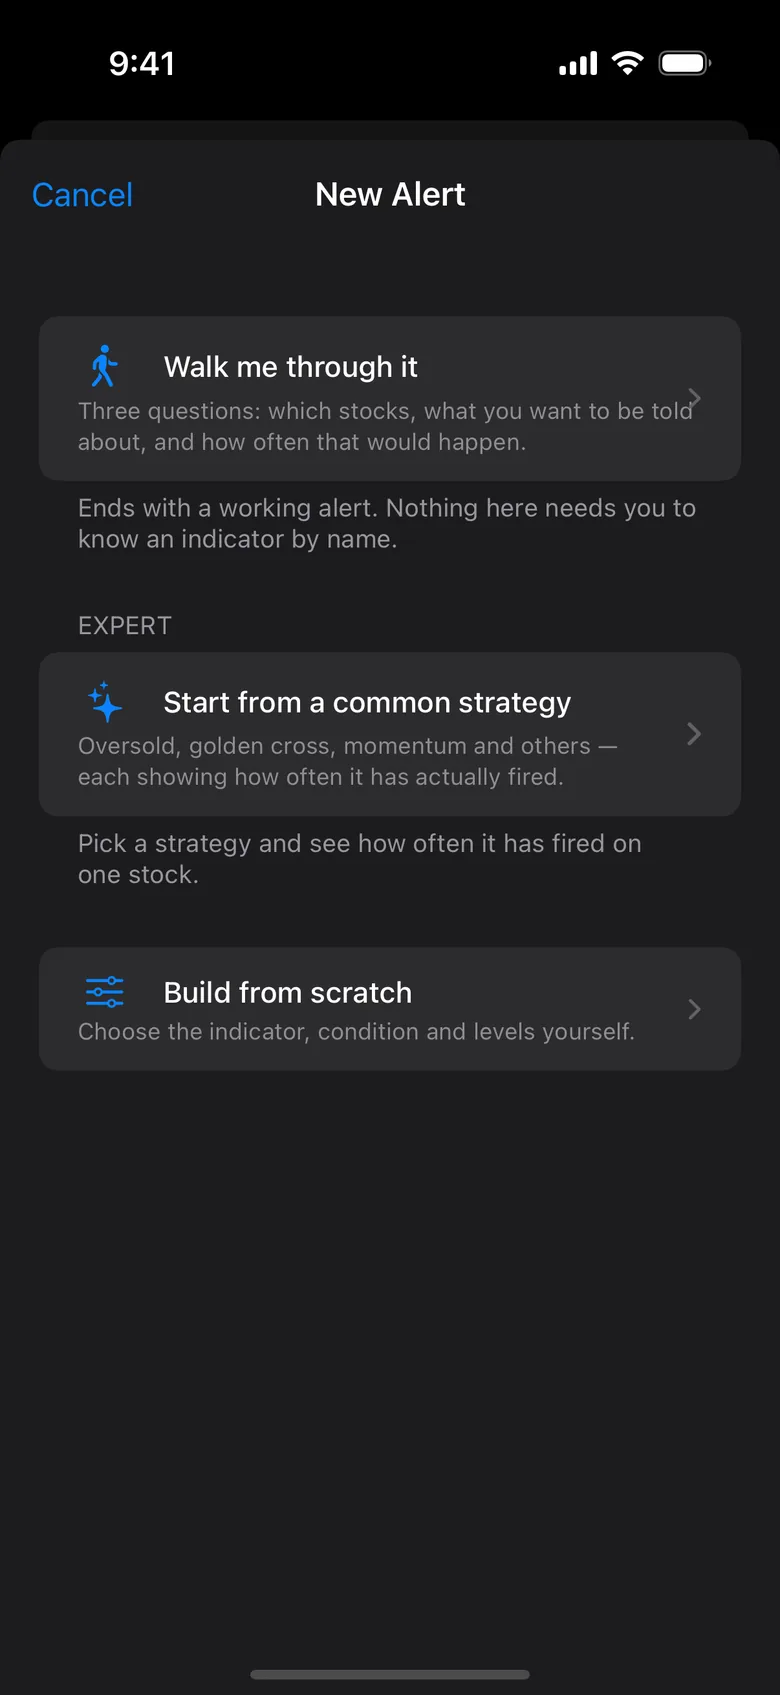
Answer three questions and it builds the alert for you, start from a strategy that already works, or set the indicator and the level yourself. Nothing here needs you to know an indicator by name.
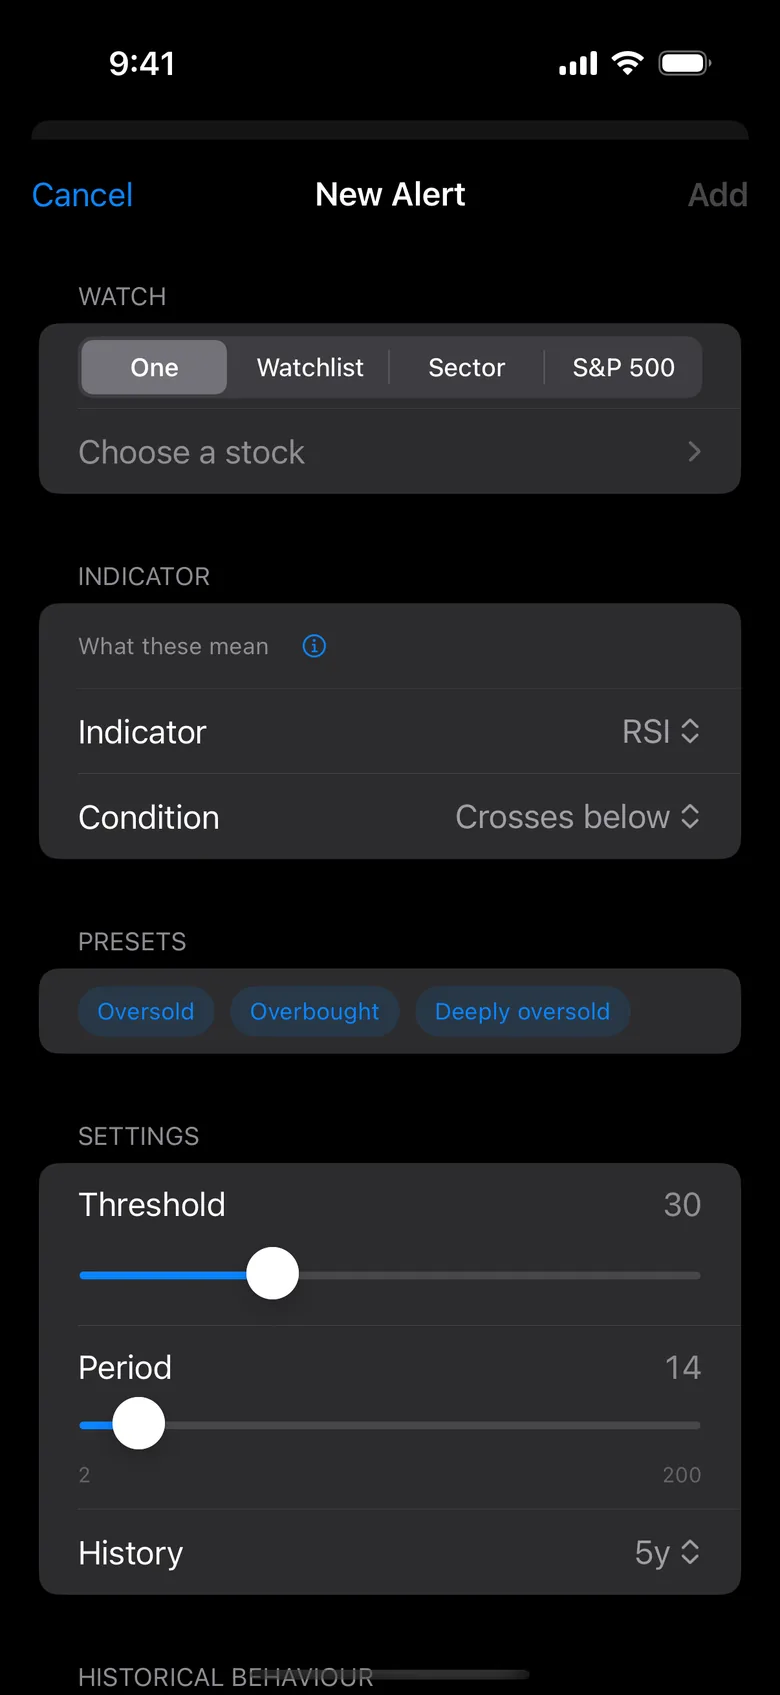
Any indicator, any level. One stock, your watchlist, a sector, or all 503 — as a single rule rather than five hundred.
How often this exact rule fired, every date it happened, and what the stock did in the ten days after each one.
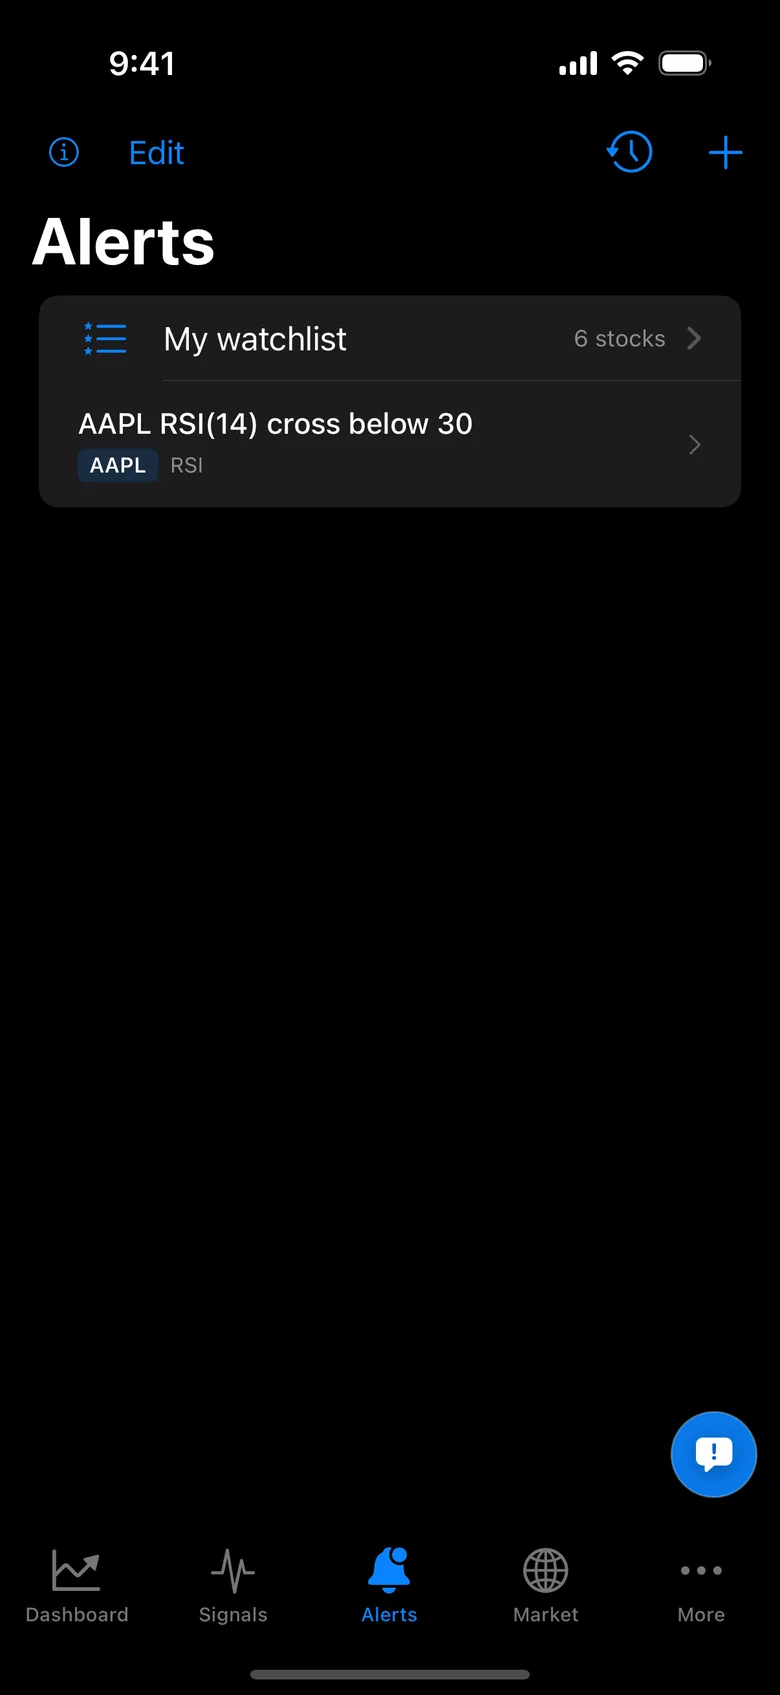
One notification per crossing, once per event. Never the same signal twice because it stayed there.
Create an account, know your favorite companies and set meaningful alerts, so you can find out when the condition is right.
Get started